The client, who is an established accountants practice came to us to discuss their energy consumption demands in the face of rising energy costs and climate levies and wondered what we could do about it. With around 30 people in this particular building all using air conditioning to heat and cool, and also all of the associated computer equipment and lighting they were experiencing some rather high electric bills. They were looking to the future and investing in electric cars for the staff too which would have raised their energy consumption considerably.
Our solution was to install 125 370-watt JA Solar All black panels onto 3 parts of the roof coupled with a 33Kw 3-phase Solar Edge inverter and P801 optimizers. We also installed 2no 3 phase 22kw Easee EV charge points for use by the staff and clients accessible via an RFID Fob. SolarEdge developed an intelligent inverter solution that changed the way power is harvested and managed in photovoltaic (PV) systems.
The SolarEdge DC optimized inverter (optimizer) maximizes power generation while lowering the cost of energy produced by the PV system. These make each panel 25% more productive and 99.5% efficient, it also allows us to monitor each pair of panels and see exactly what they are producing. If there are any issues with the panels this will flag up on our monitoring management portal and we can then address these. It will shut down those individual panels as opposed to a whole string of panels not functioning as per a traditional installation.
The beauty of these optimizers is from a safety point of view, if the inverter for whatever reason loses grid connection, it drops every pair of panels down to 1 volt for safety so that no one will receive a shock from the panels in the event of fire or damage. We can also link this into a fire alarm system so it shuts down solar production should the fire alarm be triggered.
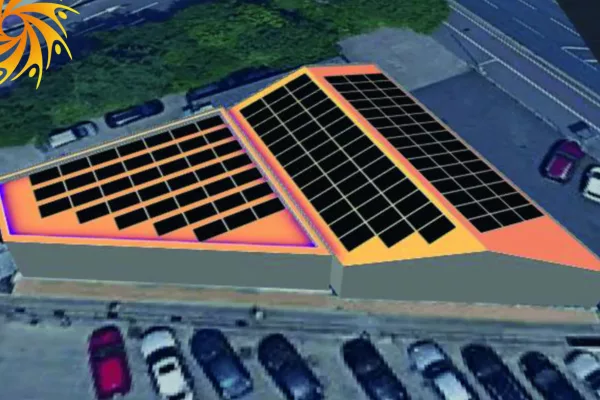
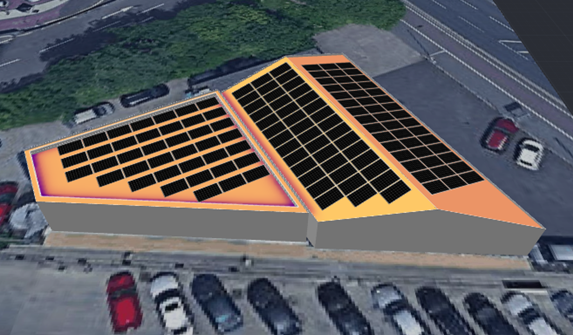
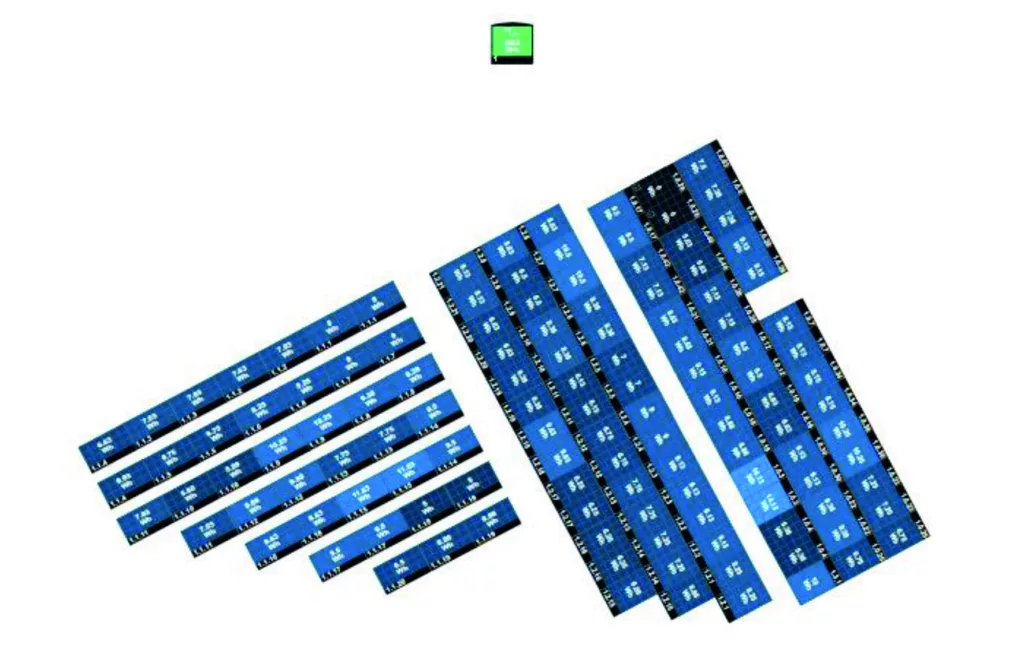
The Design
As you can see below we have modeled the property and placed the panels onto the roof areas
with the best irradiance figures to achieve the best yield. The front area to the right of this picture
was a Renusol rail mounting system fixed to the roof, the rear area was a type of steel roof which
required specialist brackets to fit that exact profile and then attach the rails to this.
Each design is weight and wind loadings calculated to ensure the structure will take the
adaptations. For some projects we also use a structural engineer to produce a report to confirm
the suitability.
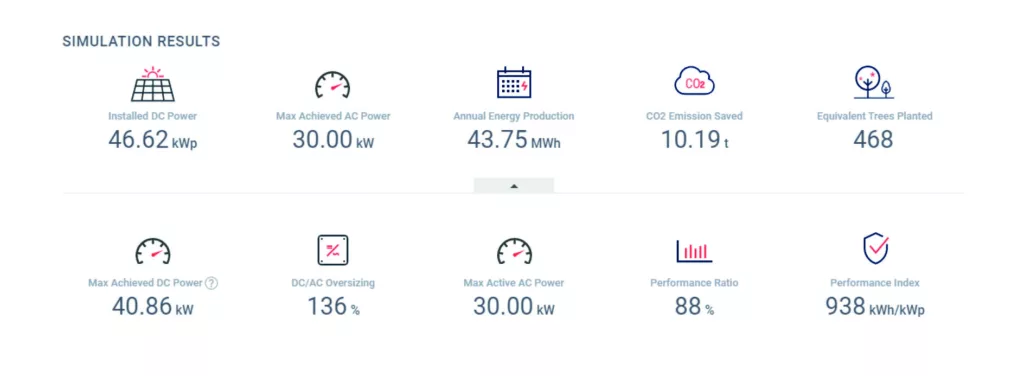
The Solar Simulation
Each design has its individual simulation based on the panels, irradiance, azimuth and output.
This gives us an overview of what is proposed. To produce as much power through the winter
months we ‘oversize’ the array to capture as much sunlight as possible through these months. The
inverter is a 30kw inverter so it will never produce more than that figure.
Simulated production
When creating a proposal we always request energy consumption figures from the client to be
able to produce a large enough system to cater for their needs. The right hand chart shows that
we estimated based on the design that the property would benefit from 54% self consumption. In
reality this was rather different as you will see further on.
Financials
All of our reports also include a financial summary, this is based on the output of the proposed system, current annual energy consumption and price paid per Kwh. We can also show a return on investment.
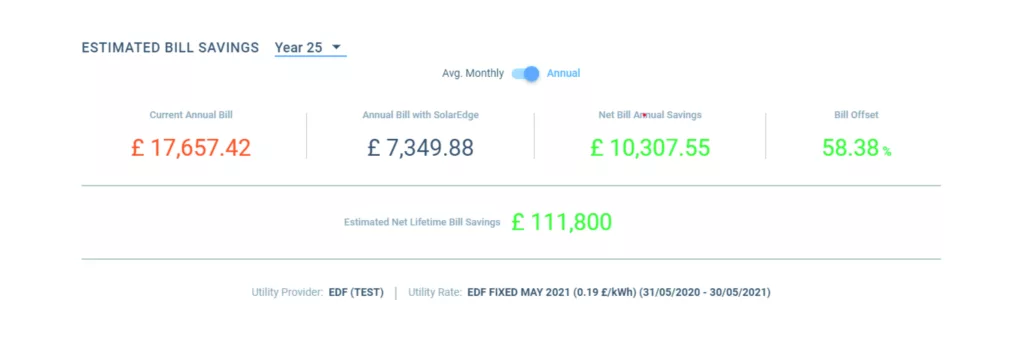
As you can see from the table below this client was projected to be saving £111,800 on their energy
bills over the next 25 years (warranty period of the system). This is based on the rates rising by 3% per
year and also a projected consumption of the new EV charge points. It even included the O and M
costs of £150 yearly service built into the figures.
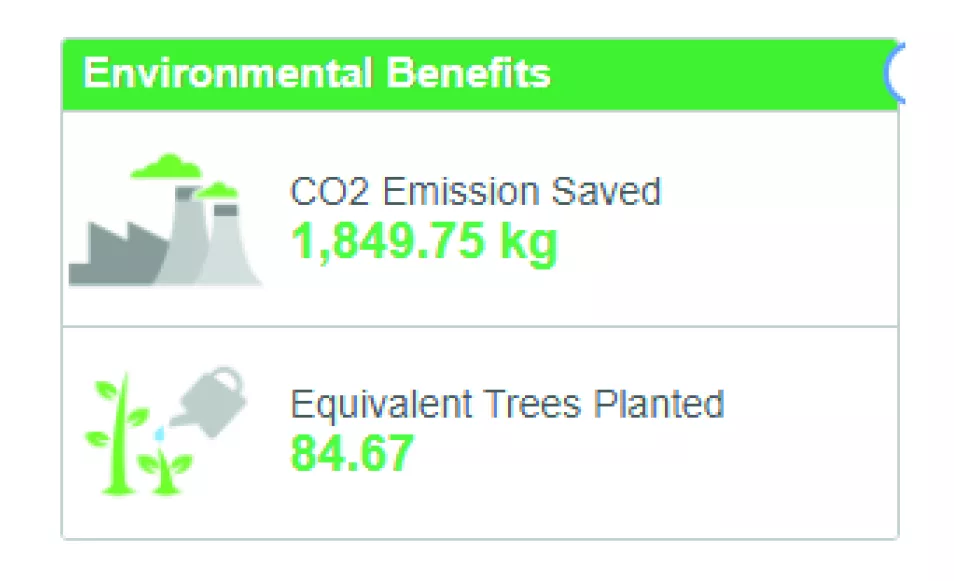
Environmental Benefits
Through the online monitoring portal you have the ability to track several items and an aspect
of this that is becoming very important to companies, clients and staff alike is being able to
display the environmental benefits of the installation. Below is what this client has achieved in
the last 2 months alone.
Being a Solar Edge client they are able to also access ‘kiosk mode’. This allows a real time
screen function to a smart TV in reception to display up to date production, usage and savings
to clients and staff.
Module Level Monitoring
Solar Edge optimizers give the ability to have module level monitoring to be able to track each
panels production and also be notified if there are any faults that occur. This will be alerted in
the online or mobile app portal and can be remotely accessed to investigate the cause of the
fault. This optimization allows the array to maximize production by an additional 25%.
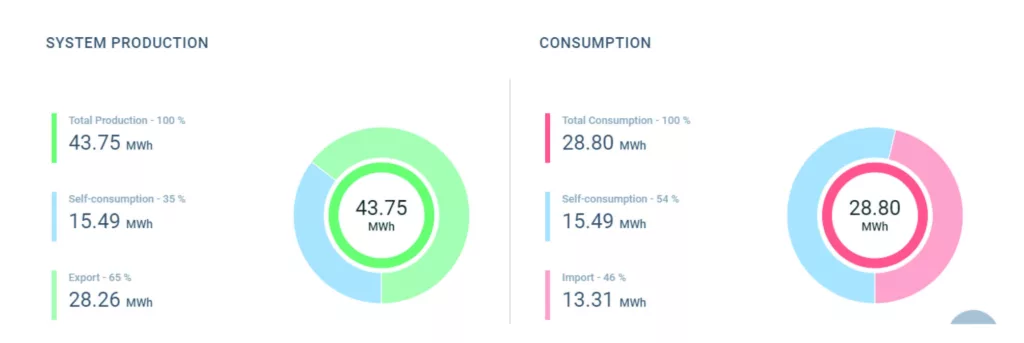
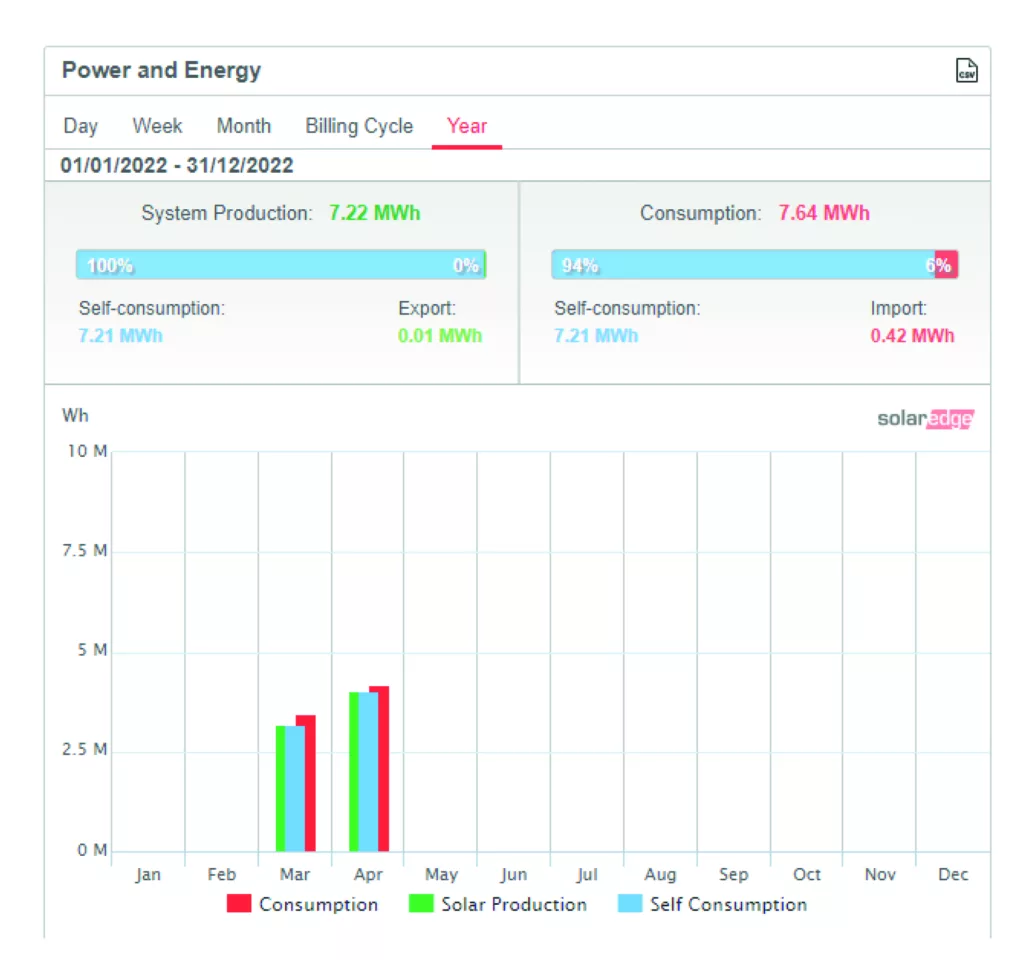
Total production
Since the commissioning of this installation in early March 2022 you can see below that in total
the client has benefitted from consuming 94% of their own generated power and only importing
6% from the grid, thus reducing their energy bills also by 94%! You can use the online portal to
measure production and consumption by day, week, month, billing cycle and year.
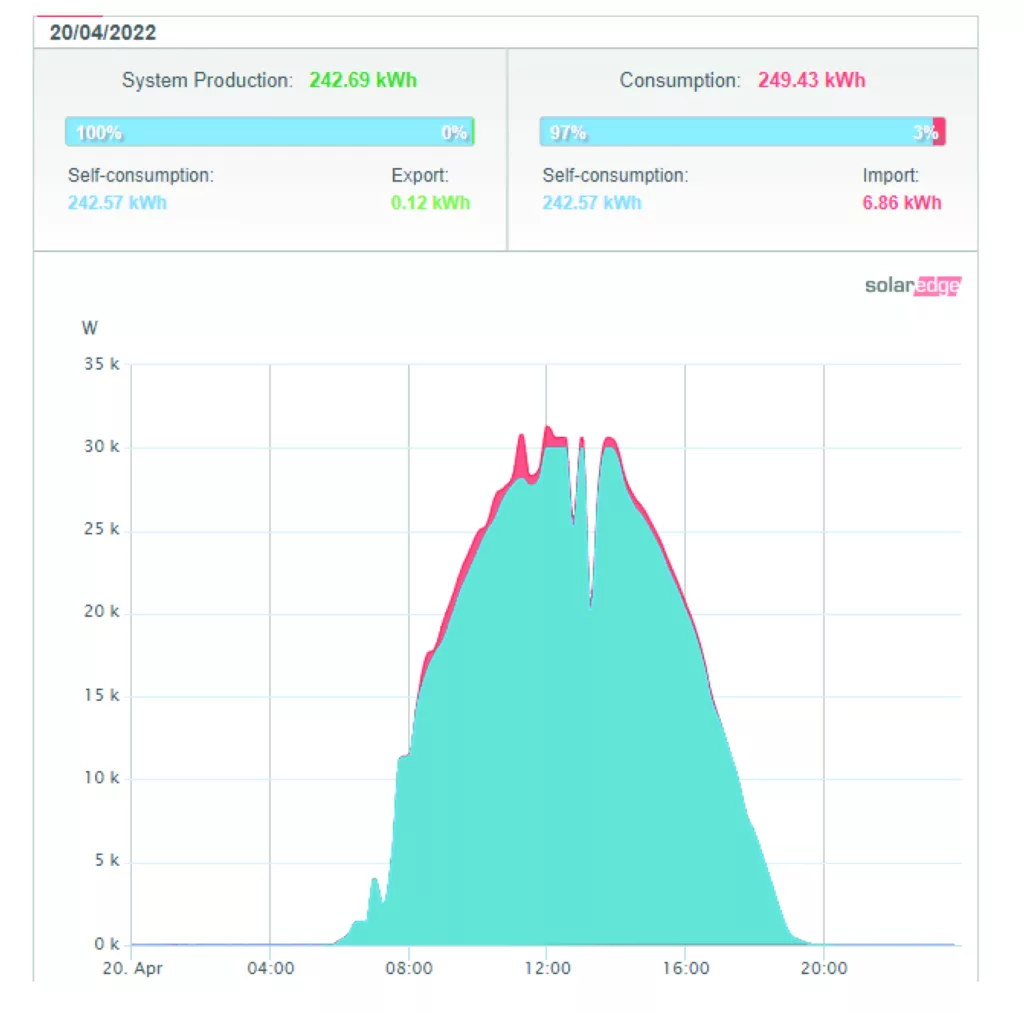
An average day
Below is an example of a typical day for this client (20th April 2022). You’ll notice that the power
from the solar is providing a self consumption figure of 97% and importing only 6.86 Kwh from
the grid. The graph shows the production and consumption of the property, the blue showing
the self consumption and the red showing the energy provided by the grid. Notice due to the
30kw inverter limiting power, anything above the 30kw mark is provided by the grid.
To see the full report on this project click here